How to Harness the Power of Work Performance Data to Improve Your Business

In today’s competitive business environment, staying ahead of the curve is essential. Companies are constantly looking for new ways to optimize their operations, increase efficiency, and boost their profits. One of the most powerful tools at their disposal is data analysis.
By leveraging work performance data, businesses can gain valuable insights into their workflows and identify key areas of improvement that can help them stay ahead of the competition.
From tracking employee engagement to monitoring customer satisfaction, harnessing the power of work performance data is essential to give any business a competitive edge. With the right approach, data analysis can revolutionize the way a business operates and help it reach its full potential.

What is Work Performance Data?
Work performance data is any information that can be used to measure the performance of an organization’s employees. This information can take many different forms and be collected in a variety of ways. Work performance data can provide a full picture of the current state of operations within a business and help identify areas of improvement that can be addressed with the right strategies.
Work performance data includes information on employee engagement levels, customer satisfaction, operational productivity, and more. This data can be collected through tools such as surveys, monitoring tools, and other tracking software. Analyzing this data can help businesses identify areas for improvement and make the right decisions that can have a significant impact on their bottom line.
Work Performance Information
The state of a project life cycle may be gleaned directly from the data collected and is called work performance information (WPI). Progress is measured in terms of how much of the work has been done, how much time has passed, the number of change requests, how much money has been spent, and other metrics.
With this, we are able to see where things are with the project right now. With these numbers in hand, you may begin developing metrics for, and eventually writing up, your company’s strategy.
For a company to be successful, it is essential to manage time wisely and plan shifts efficiently. You can use Timetrack for this purpose. The online duty roster in TimeTrack gives you the freedom to choose and organise your own workspaces. The use of different colours to denote different rooms and workspaces greatly aids in maintaining a birds-eye perspective. Each worker has a designated workspace so that you know where they are most effectively used. Plan more precisely by breaking down each task area into smaller sections.
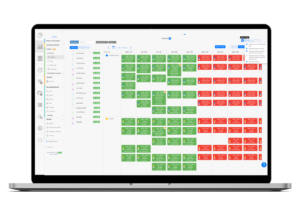
TimeTrack – Duty roster
Elements of Work Performance Data
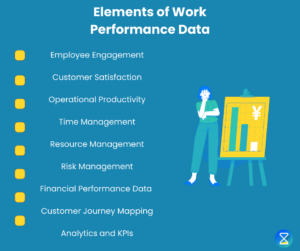
Work performance data is made up of various elements, each of which can provide insight into different aspects of an organization’s operations. These elements include:
- Employee Engagement
- Customer Satisfaction
- Operational Productivity
- Time Management
- Resource Management
- Risk Management
- Financial Performance Data and Work Performance Information
- Customer Journey Mapping
- Analytics and KPIs
How to Make Sense of Work Performance Data?
Work performance data needs to be understood in the right context. It is important to gauge the appropriate metrics that can help you make sense of the data and take actionable steps to improve overall operations.
Here are a few tips for making sense of work performance reports:
Analyze Data from Different Perspectives
The first step to making sense of work performance data is to analyze it from different perspectives. This can be done by dividing the data into different segments. For example, the work performance data of a particular department, business unit, or retail location can be segmented to understand performance on a localized level.
Gather Data from Different Sources
In addition to segmenting the data, it is important to gather data from different sources. This will allow businesses to gain a more holistic picture of the current state of operations and identify areas of improvement.
Use Data Across Multiple Dimensions
This will help businesses cross-correlate data and understand it in a richer way. This will also help businesses identify meaningful insights.
Use Data in its Entirety
It is important to use data in its entirety to make sense of it fully.
How to Use Work Performance Data to Plan Operations?
Once work performance data has been collected and understood, businesses can use it to plan their operations and make informed decisions. Data-driven operations can help businesses optimize their workflows, improve their efficiency, and boost their overall profits.
Here are a few ways businesses can use work performance reports to plan operations:
Identify Problem Areas
Data analysis can help businesses identify problem areas in their operations. This can include unproductive workflows, inefficient resource management, and customer dissatisfaction.
Create Goals
Once problem areas have been identified, businesses can create goals that will help them resolve these issues. This will help businesses understand what needs to be done to resolve issues and reach their full potential.
Create KPIs and Metrics
Once goals have been set, it is important to create metrics and key performance indicators (KPIs) to gauge their progress. This will help businesses understand how each goal is being approached and provide insight into areas of improvement from various controlling processes.
Put Data into Action
Once metrics and KPIs have been set, it is time to put the project management data into action. This will help businesses address problem areas, know the status of and achieve the goals of the project as specified in the PMBOK guide.
Examples of Work Performance Data – The Elements

- Employee Engagement – Employee engagement is an important metric that can provide insight into the overall happiness of employees. This data can be collected through surveys and provide an accurate representation of how employees feel about their work environment.
- Customer Satisfaction – Customer satisfaction is an important metric that can provide insight into the happiness of customers. This data can be collected through surveys and provide an accurate representation of how customers feel about the level of service they received and control project work.
- Operational Productivity – Operational productivity is a metric that can provide insight into the amount of work being done by a company’s employees. This data can be collected through monitoring tools and provide an accurate representation of the amount of work being done.
- Time Management – Time management is a metric that can provide insight into the amount of time employees spend on certain tasks. This data can be collected through monitoring tools and provide an accurate representation of the amount of time spent on different tasks.
- Risk Management – Risk management is a metric that can provide insight into the amount of risk being taken by a company. This data can provide an accurate representation of the amount of risk being taken on by a business.
- Financial Performance – Financial performance is a metric that can provide insight into the financial state of an organization. This data can be collected through monitoring tools and provide an accurate representation of the financial situation of a business. This can be an important metric for businesses to consider and it can be used to identify problem areas in the financial side of operations that need to be resolved.
- Customer Journey mapping – Customer journey mapping is a metric that can provide insight into the customer journey that takes place in an organization. This data can be collected through surveys and provide an accurate representation of the customer journey. This can be an important metric for businesses to consider and it can be used to identify problem areas in the customer journey that need to be resolved.
- Analytics and KPIs – Analytics and KPIs are important metrics that can provide insight into the state of an organization’s operations. This data can be collected through monitoring tools and provide an accurate representation of the current state of operations. This can be used to identify areas of improvement in operations.
Conclusion
Work performance data can prove to be a powerful tool for analyzing a company’s overall stance and performance. It can also provide insights into the statistics of the business which are often essential for analyzing growth.
If you need a tool to collect employee time data and work performance information by tracking, then Timetrack is the right tool for you. Appointments may be quickly made and managed in the calendar view. You may choose between a daily, weekly, or monthly view to find the most suitable one. The columns in the calendar may be arranged in any way you choose. If your work schedule doesn’t span the whole week, you may choose to exclude some days.

Anja Bosiok ist Marketing Managerin bei TimeTrack und schreibt seit über drei Jahren über Zeitmanagement, moderne Arbeitswelt und digitale HR-Prozesse. Sie studierte Journalismus (Bachelor) sowie Publizistik- und Kommunikationswissenschaft (Magister) und verbindet redaktionelle Präzision mit tiefem Produktverständnis. Zuvor war sie als Content Managerin bei TimeTrack tätig und begleitet seitdem die Themen rund um Arbeitszeiterfassung und Personalorganisation – von der gesetzlichen Grundlage bis zur praktischen Umsetzung im Unternehmensalltag.